Capture Your First Error
Now that the demo app is up and running on your local environment integrated with the Sentry SDK, you're ready to generate the first error.
If you're not using the provided React demo code, follow the Verification step to introduce an error to your source code and then continue with Step 2 here.
Step 1: Capture your first event
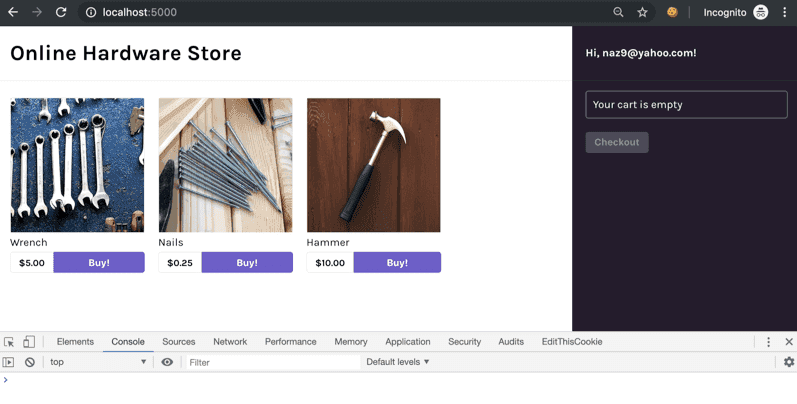
Launch the demo app by opening the localhost link in your browser.
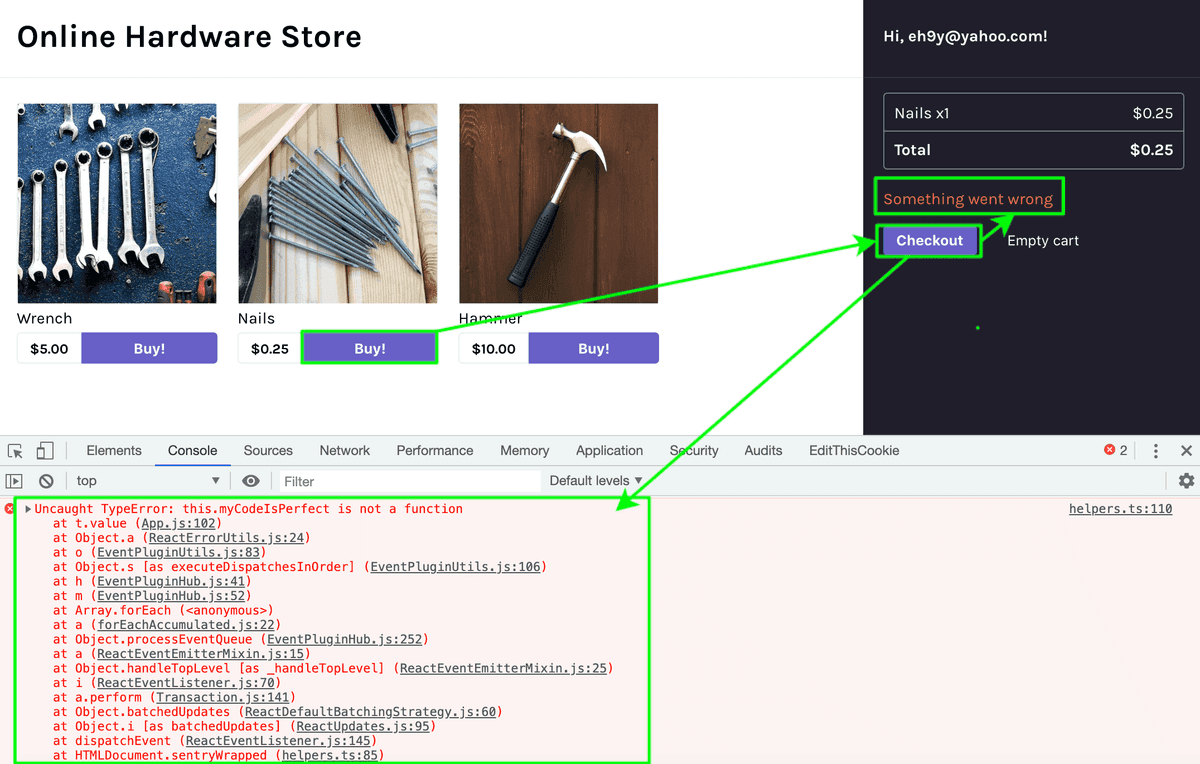
Open the browser's "Console" to verify that an error has occurred.
Click on any of the "Buy!" buttons to add products to your shopping cart.
Click the "Checkout" button on the right panel to generate an error.
Notice that:
Step 2: Handle the error
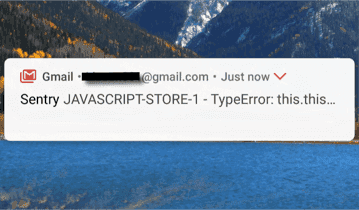
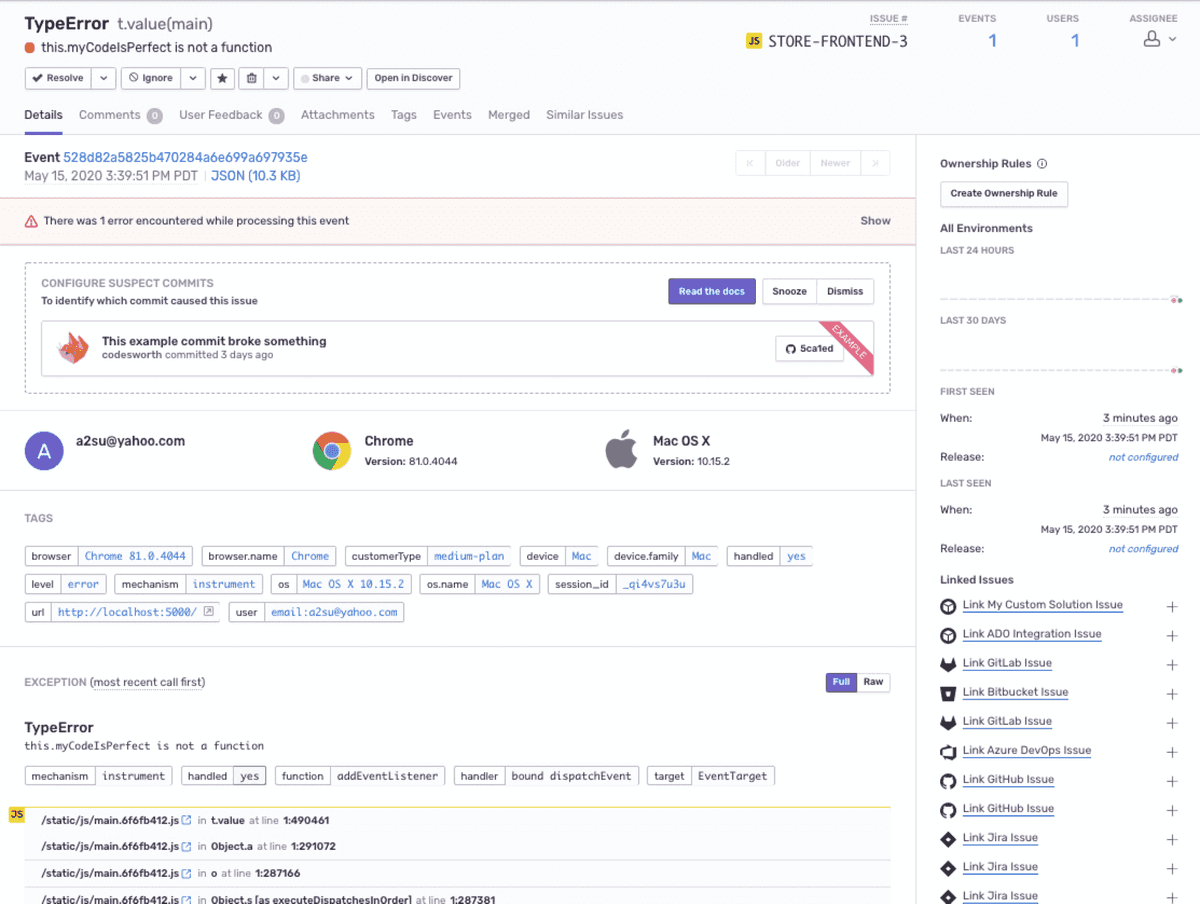
Go to your email and open the notification from Sentry.
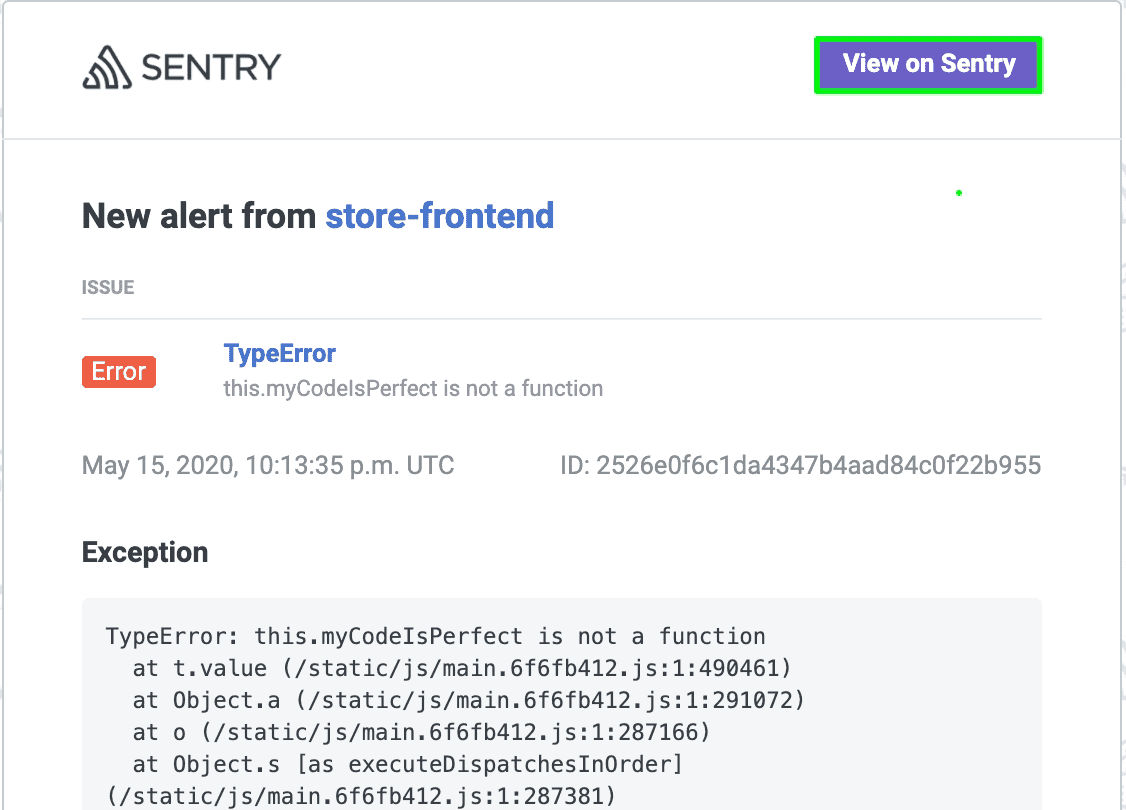
Click "View on Sentry" to view the full details and context of this error in your Sentry account.
Note that Sentry aggregates similar errors (events) into one issue.
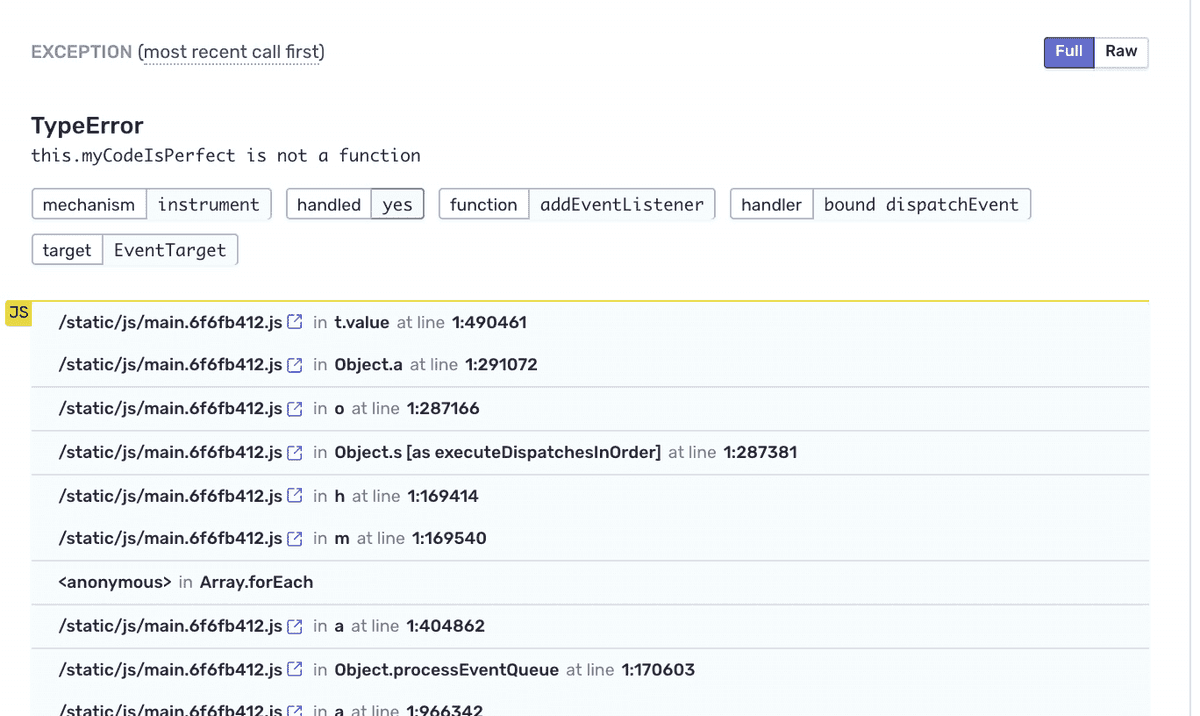
In your account, scroll down to the "Exception" stack trace.
- Notice that the stack trace is minified. JavaScript is typically minified to reduce to the size of the source code.
- Sentry can unminify the code back to its readable form and display source (code) context lines in each stack frame, which is covered in the next section.
Next
Enable Readable Stack Traces in Your Errors
Our documentation is open source and available on GitHub. Your contributions are welcome, whether fixing a typo (drat!) to suggesting an update ("yeah, this would be better").
